
Resources
This carefully curated collection of resources will help you find packages and learning resources to help you on your R journey.
{FakeDataR}
{FakeDataR} is an R package that provides a local solution for creating synthetic copies of real datasets, preserving their structure, schema, types, and privacy. It prevents the risk of exposing sensitive data and is designed to support Large Language Model (LLM) workflows and reproducible sharing. The package includes heuristics for identifying sensitive fields, with the ability to fake or drop them, and supports exporting synthetic data along with a JSON schema and README prompt for LLM bundles. It's a suitable tool for creating quick, privacy-preserving synthetic data without the need for cloud processing.
Go to Resource

10 years of rio
This is a blog post titled '10 years of rio' by Chung-hong Chan. It discusses the history and development of the R language package 'rio', which is similar to stringr. The author talks about the motivation behind creating the package and the design principles used. The package provides functions for importing and exporting data in various formats, with a consistent API. The post also mentions the compatibility of the package with older versions of R.
Go to Resource

A Scientist's Guide to R: Step 2.1. Data Transformation - Part 1
This post is part of the Scientist's Guide to R series and focuses on data transformation techniques for wrangling, tidying, and cleaning data. It introduces the core functions of the dplyr package, as well as other relevant functions in base R. The post covers topics such as selecting columns, filtering rows, modifying columns, obtaining descriptive summaries of data, assigning grouping structures, and arranging data frames. The post also mentions the data.table package for working with large datasets. The examples in the post demonstrate how to use the select() function from the dplyr package to subset columns from a data frame.
Go to Resource
A year with Visible Long-Covid Tracking
Dr. Mowinckel shares insights on a year-long journey of tracking Long Covid symptoms using the Visible app. The app monitors heart rate, HRV, daily symptoms, and functional capacity through the FUNCAP27 questionnaire. The post details the process of collecting and analyzing personal health data to understand recovery patterns, pacing strategies, and warning signs. The blog also offers a look at tools within Visible that help visualize progress, such as heart rate graphs and a functional capacity semi-circle, providing a valuable resource for individuals managing Long Covid.
Go to Resource
Access and Manipulate Comprehensive Country Level Data in Tidy Format • tidycountries
The tidycountries package in R provides a comprehensive interface for accessing and manipulating country-level data. It includes details such as names, regions, populations, currencies, and more in a tidy format that integrates with the tidyverse. It's useful for global research, visualizations, and querying country information. The package can be easily installed from CRAN or GitHub and integrates well with the tidyverse, making data manipulation straightforward.
Go to Resource
Analyzing my music listening data with Positron's Databot
Simon Couch explores his music listening data using Databot, an AI agent within Positron. He exports his iTunes Library metadata as an .xml file and uses the tidyverse in R to conduct a personalized analysis akin to Spotify Wrapped. Couch highlights Databot's ability to understand and manipulate the .xml data structure, converting it into a tidy tibble and performing various data wrangling tasks to identify top songs, artists, and albums. This post illuminates how Databot can simplify and accelerate exploratory data analysis, demonstrating its applications on actual personal data and providing insights into his musical preferences.
Go to Resource
Applied Data Skills
The 'Applied Data Skills' book by Emily Nordmann and Lisa DeBruine is designed to teach the fundamentals of data processing and presentation using R. It guides learners through data import, cleaning, summarization, visualization, and report generation, aiming to provide skills for professional reporting and presenting. The book is part of a 10-week course with each chapter introducing new concepts and practical exercises. It emphasizes learning through practice, error resolution, and the efficient use of help resources rather than memorization. The goal is to enable learners to create automated, updateable reports and visualizations with R.
Go to Resource
Bluesky conversation analysis with local and frontier LLMs with R/Tidyverse
This content details the author's exploration of bluesky conversation analysis using R and the Tidyverse suite, specifically focusing on local and frontier large language models (LLMs). The author leverages R packages atrrr, ellmer in the tidyverse, mlverse/mall, and interfaces with models such as Claude & Ollama. Processes include summarizing posts, performing sentiment analysis, and posting summaries to GitHub via the gistr R package. Techniques include data retrieval, text analysis, and summarization, showcasing how open models can provide insights into community discussions on Bluesky, particularly within the R community's use of the #Rstats hashtag.
Go to Resource

breakerofchains
Break your chain at the cursor line. Run the first bit. See the output. Be free.
Go to Resource

Coloured text in {ggplot2}: {ggtext} vs {marquee}
This content compares two R packages, {ggtext} and {marquee}, which allow users to add colored text to {ggplot2} visualizations as an alternative to a traditional legend. It discusses the suitability of this approach for categorical data and provides examples using lemur data from Duke Lemar Center. The tutorial includes data wrangling with {dplyr} and creating a scatter plot in {ggplot2}, as well as describing the use of HTML and CSS for text formatting in the {ggtext} package.
Go to Resource
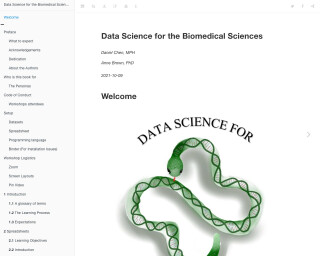
Data Science for the Biomedical Sciences
Data Science for the Biomedical Sciences is a book that provides an introduction to data science concepts and tools specifically tailored for the biomedical sciences. It covers topics such as spreadsheets, R and RStudio, data loading, descriptive calculations, data cleaning, visualization, analysis, working with multiple datasets, APIs, functions, survival analysis, machine learning, and more.
Go to Resource

Data wrangling for spatial analysis: R Workshop
Data wrangling for spatial analysis: R Workshop
Go to Resource