
Resources
This carefully curated collection of resources will help you find packages and learning resources to help you on your R journey.
{FakeDataR}
{FakeDataR} is an R package that provides a local solution for creating synthetic copies of real datasets, preserving their structure, schema, types, and privacy. It prevents the risk of exposing sensitive data and is designed to support Large Language Model (LLM) workflows and reproducible sharing. The package includes heuristics for identifying sensitive fields, with the ability to fake or drop them, and supports exporting synthetic data along with a JSON schema and README prompt for LLM bundles. It's a suitable tool for creating quick, privacy-preserving synthetic data without the need for cloud processing.
Go to Resource

10 years of rio
This is a blog post titled '10 years of rio' by Chung-hong Chan. It discusses the history and development of the R language package 'rio', which is similar to stringr. The author talks about the motivation behind creating the package and the design principles used. The package provides functions for importing and exporting data in various formats, with a consistent API. The post also mentions the compatibility of the package with older versions of R.
Go to Resource

A Scientist's Guide to R: Step 1. Getting Data into R
A tutorial on getting data into R, covering various file formats like .csv, .txt, .xlsx, etc.
Go to Resource
A year with Visible Long-Covid Tracking
Dr. Mowinckel shares insights on a year-long journey of tracking Long Covid symptoms using the Visible app. The app monitors heart rate, HRV, daily symptoms, and functional capacity through the FUNCAP27 questionnaire. The post details the process of collecting and analyzing personal health data to understand recovery patterns, pacing strategies, and warning signs. The blog also offers a look at tools within Visible that help visualize progress, such as heart rate graphs and a functional capacity semi-circle, providing a valuable resource for individuals managing Long Covid.
Go to Resource
Access and Manipulate Comprehensive Country Level Data in Tidy Format • tidycountries
The tidycountries package in R provides a comprehensive interface for accessing and manipulating country-level data. It includes details such as names, regions, populations, currencies, and more in a tidy format that integrates with the tidyverse. It's useful for global research, visualizations, and querying country information. The package can be easily installed from CRAN or GitHub and integrates well with the tidyverse, making data manipulation straightforward.
Go to Resource
Access South Korean Data via Public APIs and Curated Datasets • SouthKoreAPIs
The SouthKoreAPIs package is a comprehensive R tool for accessing South Korean open data from various public APIs and curated datasets. It interfaces with the World Bank API, Nager.Date API, and REST Countries API to fetch a range of information, such as economic indicators and national holidays. Additionally, it boasts an extensive collection of datasets encompassing public health, demographics, social surveys, and more. Its utility functions facilitate the retrieval of specific data points, like mortality rates and GDP, while its organized datasets enable in-depth analysis of South Korean socioeconomic and cultural patterns.
Go to Resource
Applied Data Skills
The 'Applied Data Skills' book by Emily Nordmann and Lisa DeBruine is designed to teach the fundamentals of data processing and presentation using R. It guides learners through data import, cleaning, summarization, visualization, and report generation, aiming to provide skills for professional reporting and presenting. The book is part of a 10-week course with each chapter introducing new concepts and practical exercises. It emphasizes learning through practice, error resolution, and the efficient use of help resources rather than memorization. The goal is to enable learners to create automated, updateable reports and visualizations with R.
Go to Resource
Charting 'tidycensus' data with R
This blog post by USGS Vizlab discusses how to use the 'tidycensus' R package to download and visualize U.S. Census Bureau data. It highlights visualizations such as line charts, bubble maps, cartograms, geofaceted area plots, rainfall plots, and grid charts. The post includes code examples and downloadable functions from GitHub to replicate these visualizations using data on 'households lacking plumbing' from the 2022 and 2023 ACS. It offers a practical guide for users interested in creating similar visualizations for demographic and socioeconomic data within the United States.
Go to Resource
Chat with Large Language Models • {ellmer}
The 'ellmer' package facilitates the use of large language models (LLMs) directly from R. It provides access to multiple LLM providers and features like streaming outputs and structured data extraction. 'ellmer' supports models such as Anthropic's Claude, AWS Bedrock, and OpenAI's GPT, among others. The package offers interactive and programmatic ways to converse with models, maintaining the conversation state, which is useful for building on previous interactions. 'ellmer' is practical for both organizational and personal use, accommodating various IT restrictions and preferences.
Go to Resource
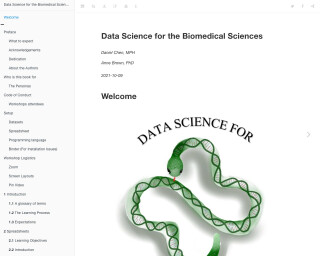
Data Science for the Biomedical Sciences
Data Science for the Biomedical Sciences is a book that provides an introduction to data science concepts and tools specifically tailored for the biomedical sciences. It covers topics such as spreadsheets, R and RStudio, data loading, descriptive calculations, data cleaning, visualization, analysis, working with multiple datasets, APIs, functions, survival analysis, machine learning, and more.
Go to Resource

data.table
data.table provides a high-performance version of base R’s data.frame with syntax and feature enhancements for ease of use, convenience and programming speed.
Go to Resource
Duplicating Quarto elements with code templates to reduce copy and paste errors
This blog post from the Water Data For The Nation Blog demonstrates how to use Quarto code templates to create reproducible Quarto documents, such as reports and slideshows, with fewer errors. Using custom templates allows for the easy replication of code chunks, such as those producing statistical summaries or visualizations for different datasets. The example used is USGS streamgage data, with a focus on automating the creation of slideshows in Quarto's markdown format. Advanced topics like adding columns, tables, and speaker notes to PowerPoint slides via Quarto are also covered. Methods for iterating over data in a more efficient and less error-prone way than traditional copy and paste techniques are highlighted.
Go to Resource