
Resources
This carefully curated collection of resources will help you find packages and learning resources to help you on your R journey.
LibreTranslate API for R: translate, detect languages
libretranslateR is an R package that provides a binding to the LibreTranslate API, enabling users to perform translation tasks, detect languages, and list available languages for translation, all from within R. The package includes a user-friendly wizard for configuration, and allows connections to any LibreTranslate instance, offering flexibility and offline translation capabilities by hosting your own instance. Currently not available on CRAN, it can be installed directly from GitHub via the 'remotes' package, and comes with features like auto-detection of languages, translation without leaving R, and future enhancements like file translation and more user-friendly language names.
Go to Resource
Listening to complex tones using sine waves and toneR
The post details an experiment with auditory perception by converting chord patterns into complex tones through programming. Matt Crump describes using the R package {toneR} to synthesize chords as sums of sine waves at varying frequencies and amplitudes, resulting in complex tonal renderings. Initial code examples involve AI model 'Dreamshaper' generating art from prompts, with a musical focus. Subsequently, the tutorial shifts to R code for audio synthesis and processing. This exploration rekindles the author's previous academic work on complex tones and their perceptual effects, inviting readers to join in the auditory experiment.
Go to Resource
Lotas - AI for RStudio | Rao Code Editor
Rao Code Editor by Lotas is an AI-powered tool designed to enhance the RStudio workflow. It offers an intelligent code editor that understands project files and data, enabling it to generate and edit code efficiently. Rao writes R scripts and R markdown files, fixes errors, and improves analyses. It also comprehensively analyzes output, including console results and data visualizations, providing suggestions and insights into the code's implications. Available with a free tier, Rao aims to streamline the coding process for RStudio users.
Go to Resource
Make simpler working with environmental data products • tidypollute
tidypollute is an R package designed to streamline the process of working with EPA AirData flat files and AQS API for environmental data analysis. Developed by Dr. Nelson Roque, the package provides tools for importing, cleaning, analyzing, and visualizing large-scale air pollution datasets. It's built with the tidyverse ethos, ensuring tidy and efficient data handling. Key features include processing EPA data files, extracting Atmotube Cloud API data, and soon to be added are real-time API queries, quick visualization tools, documentation generation, and demographic data integration.
Go to Resource
Mapping water insecurity in R with tidycensus
This content provides a comprehensive guide on utilizing the tidycensus package in R to map water insecurity based on American Community Survey data. It elaborates on setting up the tidycensus environment, exploring Census Bureau variables, and performing data processing. Techniques like data visualization with tigris and sf packages are also covered. The tutorial highlights differences in plumbing facilities and compares population versus plumbing access across Western U.S. counties. With practical code examples, it aids readers in understanding and visualizing the spatial variation of social vulnerability indicators affecting water insecurity.
Go to Resource
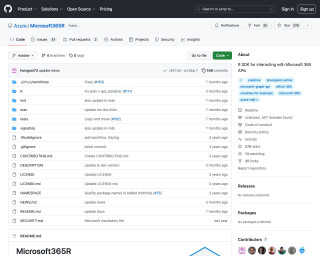

Modern Data Visualization with R
Modern Data Visualization with R is a comprehensive guide by Robert Kabacoff on data visualization techniques using the R programming language. This book, available in both online and print versions, emphasizes the use of ggplot2 for creating a variety of charts and plots. Covering topics from importing and cleaning data to customizing and saving graphs, the book includes worked examples and best practices to help readers create publication-ready graphics. The content also introduces interactive graphing tools and offers advice on graph aesthetics such as color choice and signal-to-noise ratio.
Go to Resource
Positron Assistant: GitHub Copilot and Claude-Powered Agentic Coding in R
Positron Assistant is a tool that integrates with GitHub Copilot and Anthropic Claude to offer advanced code completion and interaction for R programming. It provides a seamless experience for users switching from RStudio by offering a comprehensive feature set, including remote SSH sessions. With Positron Assistant, users can generate or refactor code, ask questions, get debugging assistance, and receive project guidance within the Positron environment. It simplifies the process of creating R packages, documenting with Roxygen2, and writing unit tests with testthat, demonstrating its capability through agent mode.
Go to Resource
Price index data for the US economy
The 'realtalk' R package provides datasets for common US price indexes such as the CPI-U-RS and PCE. It enables easy access and manipulation of price index data. Users can view available datasets and obtain specific price index data through functions like available_price_indexes and get_price_index(). The package also includes annual, monthly, and quarterly data with various start and end dates. Installation instructions are provided for getting started with the package. This can be especially useful for economists and data analysts working with time series data in the economic domain.
Go to Resource
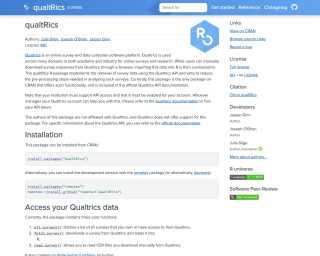
qualtRics
The qualtRics R package implements the retrieval of survey data using the Qualtrics API and aims to reduce the pre-processing steps needed in analyzing such surveys.
Go to Resource
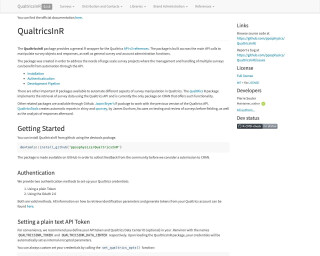
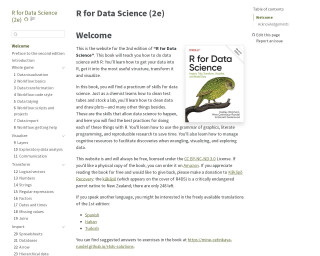
R for Data Science (2e)
R for Data Science (2e) is a comprehensive guide to performing data science tasks with R. It covers how to import, structure, transform, and visualize data while teaching best practices in data cleaning, plotting, and more. The book promotes literate programming and reproducible research to streamline work. It supports cognitive resource management for data wrangling and exploration. The content is freely available under the CC BY-NC-ND 3.0 License, with an option to support kākāpō conservation. Physical copies can be ordered on Amazon, and solutions to exercises are provided online.
Go to Resource