
Resources
This carefully curated collection of resources will help you find packages and learning resources to help you on your R journey.
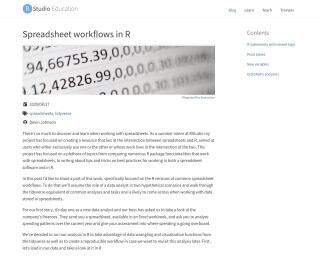
Spreadsheet workflows in R
A resource that focuses on the intersection of spreadsheets and R, providing tips and tricks on best practices for working with both. It covers the R versions of common spreadsheet workflows, such as data wrangling and visualization.
Go to Resource

Stat545
This is the table of contents for the STAT 545 resource, which covers various topics related to R programming.
Go to Resource
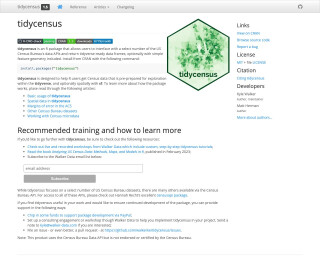
tidycensus
Load US Census Boundary and Attribute Data as tidyverse and sf-Ready Data Frames
Go to Resource
Time Series Data Sets
The timeSeriesDataSets package in R offers an extensive collection of time series datasets from diverse fields such as economics, finance, energy, and healthcare. Aimed to facilitate time series analysis, the datasets include suffixes for easy identification. For instance, AirPassengers_ts represents monthly airline passenger numbers, while taylor_30_min_df_ts indicates half-hourly electricity demand. Users can install the package from CRAN and access datasets using simple commands. This package is valuable for those seeking structured time series data for research or analysis in various domains.
Go to Resource
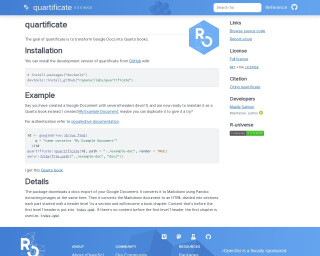
Transform Google Docs into Quarto Books with {quartificate}
The 'quartificate' package is designed to convert Google Documents into Quarto books, facilitating the transition from a simple document to a structured and maintainable book format. It streamlines the process by exporting the document into a Docx file, converting it to Markdown via Pandoc, and then sectioning it into HTML chapters based on header levels. This enables users to easily manage and render their content as a Quarto book. The package also provides seamless integration with Googledrive for authentication and document retrieval, and offers a quick start to render and view the book using the 'servr' package.
Go to Resource
Use SAS, R, and quarto Together • sasquatch
sasquatch is an R package that enables the integration of SAS, R, and Quarto for creating reproducible multilingual reports. It utilizes SASPy and reticulate to run SAS code blocks within R, transfer data between SAS and R, perform SAS client file management, and render SAS output in quarto documents. The package includes installation instructions for development version, Python, and SASPy. It offers functionality such as interactive execution of SAS code, data conversion between R and SAS, and rendering quarto documents with SAS output, distinguishing it from similar packages like sasr, configSAS, and SASmarkdown.
Go to Resource
Use SAS, R, and quarto together with sasquatch
sasquatch is a package that allows the integration of SAS, R, and Quarto to create reproducible multilingual reports. The package facilitates running SAS code blocks, managing data and files across SAS and R, and rendering outputs within Quarto or R Markdown documents. It also provides functionalities for installing dependencies like Python's SASPy, configuring SAS, especially for SAS On Demand for Academics, and managing Quarto document templates for seamless integration with SAS output. Users can pass data between R and SAS, execute code blocks interactively, and render polished documents with familiar SAS styles.
Go to Resource
Vizualizing global testosterone levels by country
This article by Aspire Data Solutions outlines the process of web scraping testosterone levels for different countries from the World Population Review website and creating a choropleth map to visualize the data in R. It demonstrates how to gather, clean, and plot geographical data, cautioning that this ecological dataset is approximate, not age-standardized, and should be used for identifying patterns rather than for precise comparisons or causal inferences. The author, Mihiretu Kebede (PhD), also includes code snippets and explanations for the R packages used.
Go to Resource
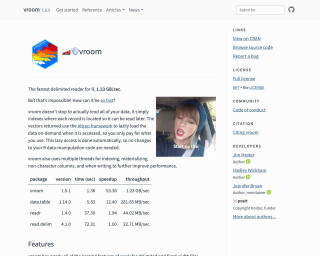
vroom
vroom is a package in R that provides the fastest delimited reader. It uses lazy loading and multiple threads for improved performance. It supports various parsing features, such as delimiter guessing, custom delimiters, column types specification, and more.
Go to Resource
Welcome to ModernDive (v2) | Statistical Inference via Data Science
ModernDive (v2) is the website for 'Statistical Inference via Data Science: A ModernDive into R and the Tidyverse (Second Edition)'. It showcases updates from the first edition, which is available online and for purchase. The book, authored by Chester Ismay, Albert Y. Kim, and Arturo Valdivia, teaches R and data science concepts. It's scheduled for print by CRC Press in 2025 and is licensed under Creative Commons. Readers can contribute on GitHub and anticipate a resource-rich approach to stats with a focus on tidyverse tools for data analysis.
Go to Resource
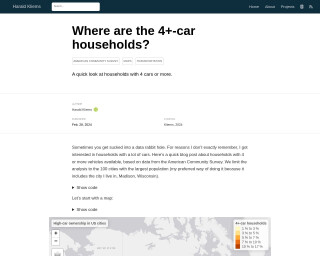
Where are the 4+-car households?
Harald Kliems investigates the prevalence of 4+-car households in the 100 most populous US cities using data from the American Community Survey. The blog post highlights the spatial distribution of such households and contrasts the top and bottom ten cities in terms of the percentage of 4+-car ownership. Key R packages used in the analysis include tidyverse, tidycensus, tigris, gt, and tmap. This examination into the facets of American car ownership is accompanied by visualizations such as maps and tables, enabling deeper insights into the data.
Go to Resource