
Resources
This carefully curated collection of resources will help you find packages and learning resources to help you on your R journey.
How to fill maps with density gradients with R, {ggplot2}, and {sf} | Andrew Heiss
Learn how to fill maps with density gradients using R, ggplot2, and sf.
Go to Resource
I ❤️ Leaflet: Using Plots as Markers
This blog post is part of the 'I love leaflet' series and provides tips and tricks for working with the leaflet R package. The post showcases how to create a map showing the results of the 2019 UK General election in Oxfordshire using the leaflet package.
Go to Resource

Interactive web-based data visualization with R, plotly, and shiny
This book provides insight and practical skills for creating interactive and dynamic web graphics for data analysis using R, plotly, and shiny.
Go to Resource
Introduction to Geospatial Raster and Vector Data with R
This lesson covers how to open, work with, and plot vector and raster-format spatial data in R. It also includes topics such as working with spatial metadata, reprojecting spatial data, and working with raster time series data.
Go to Resource
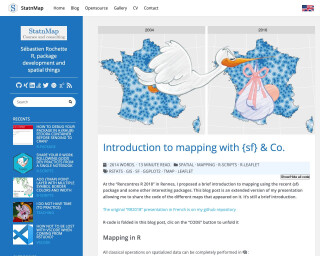
Introduction to mapping with {sf} & Co.
This blog post is an extended version of a presentation on mapping using the {sf} package and other related packages in R. It covers topics such as reading and exploring spatial data, manipulating attributes, geomatics processing, and creating static and interactive maps. The post also touches on the importance of projections and provides an example of projecting the map of Metropolitan France. The code for the different maps presented in the post is included.
Go to Resource
LA County Population Data Viz
This content outlines a detailed example of accessing and visualizing population data for Los Angeles County using R programming language. It provides insights into the population size of LA County compared to the city proper and the greater metropolitan area. Additionally, the text includes R code that interacts with the U.S. Census Bureau API, demonstrating how to retrieve, filter, and arrange population estimates with county-level granularity and geometry data for mapping. The snippet focuses on data manipulation and visualization techniques using tidyverse and tidycensus, highlighting the practical application of these tools in demographic analysis.
Go to Resource
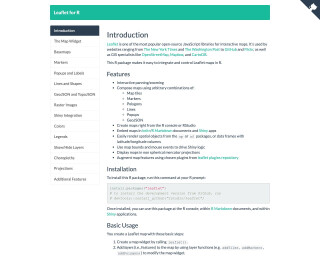
leaflet
Leaflet for R is an R package that makes it easy to integrate and control Leaflet maps in R. It provides interactive panning/zooming, the ability to compose maps using various map elements, and integration with Shiny apps. The package allows users to create maps from the R console or RStudio, embed maps in knitr/R Markdown documents and Shiny apps, and render spatial objects from the sp or sf packages. The package is widely used by websites, GIS specialists, and data visualization professionals.
Go to Resource
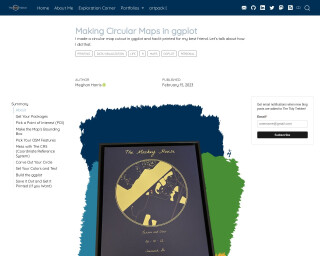
Making Circular Maps in ggplot
Meggan Harris wrote a blog post on how to create circular maps using R and ggplot2. The post describes the experience of the author as she traveled extensively in 2022 and decided to create a personalized wedding gift map for her friend. The post details the necessary R packages, picking a point of interest, and how to obtain latitude and longitude points for mapping. The author also shares code snippets for creating maps with simple features and making them look pleasing with special fonts and aesthetics. The code for the project is shared on GitHub for those who want to skip the reading.
Go to Resource
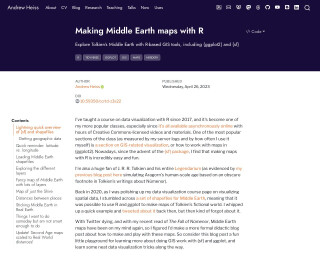
Making Middle Earth maps with R | Andrew Heiss
Andrew Heiss shares his experience in creating Middle-Earth maps using R in this educational blog post. He introduces readers to the {sf} package and demonstrates how to work with shapefiles for GIS-related visualization in {ggplot2}. Heiss, a fan of J. R. R. Tolkien, merges his expertise in data visualization with his love for Tolkien's world, offering a fun approach to learning spatial data manipulation and visualization techniques. He provides a beginner-friendly explanation of geographic data concepts and guides readers through the process of creating maps with R, using shapefiles of Middle Earth as a case study.
Go to Resource
Making Middle Earth maps with R | Andrew Heiss
This blog post by Andrew Heiss provides a tutorial on how to make Middle Earth maps using R and ggplot. It covers the use of the sf package for working with geographic data and shapefiles, as well as demonstrating data visualization tricks.
Go to Resource

mapdeck
An R library for plotting large datasets on interactive maps using Mapbox GL and Deck.gl
Go to Resource