
Resources
This carefully curated collection of resources will help you find packages and learning resources to help you on your R journey.
Mapping Antarctica
The blog post 'Mapping Antarctica' outlines the process of creating clean orthographic maps of Antarctica in R, overcoming challenges presented by polar projections and the International Date Line. The author provides a detailed tutorial to manually correct the GISCO Antarctica shapefile and eliminate projection artifacts. Using R libraries such as tidyverse, sf, and giscoR, the post guides readers through identifying and fixing geometry issues, ultimately producing a refined and accurate map visualizing the Antarctic territory.
Go to Resource
Mapping water insecurity in R with tidycensus
This content provides a comprehensive guide on utilizing the tidycensus package in R to map water insecurity based on American Community Survey data. It elaborates on setting up the tidycensus environment, exploring Census Bureau variables, and performing data processing. Techniques like data visualization with tigris and sf packages are also covered. The tutorial highlights differences in plumbing facilities and compares population versus plumbing access across Western U.S. counties. With practical code examples, it aids readers in understanding and visualizing the spatial variation of social vulnerability indicators affecting water insecurity.
Go to Resource
New, work-in-progress book on spatial data visualization in R
This is an announcement of a work-in-progress book titled Spatial Data Visualization with tmap: A Practical Guide to Thematic Mapping in R, to be published on October 14, 2025. The book is designed for various levels of expertise, from beginners to experienced GIS users and covers the usage of the tmap package in R for creating thematic maps. The online version is currently available, with the first three parts mostly complete, and further chapters in development. The tmap package has seen significant updates in version 4.0, adding features like improved defaults and expanded faceting options. The book is part of the geocompx project.
Go to Resource
Nightlife of Barcelona Neighborhoods
The blog post by Jose M Sallan provides an in-depth spatial analysis of nightlife within the neighborhoods of Barcelona. It builds on the author's previous district-level analysis to evaluate neighborhoods based on the number and density of venues. The post includes choropleth maps and data wrangling examples. To perform the analysis, it uses sf for spatial analysis, with data sourced from BAdatasetsSpatial. The author also utilizes the tidyverse and kableExtra packages for data manipulation, plotting, and creating tables. The post showcases code snippets for loading, processing, and presenting geographical information, as well as generating and interpreting maps.
Go to Resource
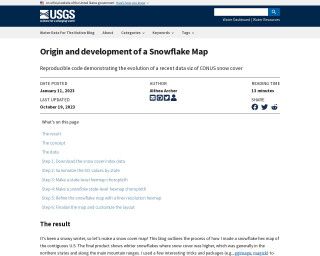
Origin and development of a Snowflake Map
This blog post describes the origin and development of a snowflake map, a data visualization technique for representing snow cover. The author explains the concept, the data used, and the steps involved in creating the map. The post also mentions the use of various packages like ggimage and magick. The final result is a snowflake hex map of the contiguous U.S. that shows average snow cover.
Go to Resource
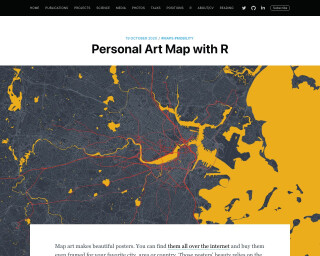
Personal Art Map with R
Learn how to create personal art maps with R using data from Open Street Maps (OSM) and personal mobility data. This tutorial provides step-by-step instructions on downloading street maps, collecting highway and street data, and combining them to create personalized maps.
Go to Resource
R as GIS, Part 1
This post is part of a series that explores the GIS capabilities of R, focusing on working with vector spatial data using the `sf` package. It covers topics such as loading spatial data, manipulating sf objects using dplyr functions, and working with coordinate reference systems.
Go to Resource
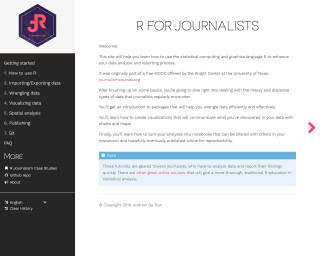
R for Journalists
This is a resource for journalists to learn how to use the R programming language for data analysis and reporting. It covers topics such as installing R and RStudio, importing/exporting data, data wrangling, data visualization, spatial analysis, publishing with RMarkdown, and using Git for version control. The tutorials are designed to help journalists quickly analyze data and report their findings.
Go to Resource
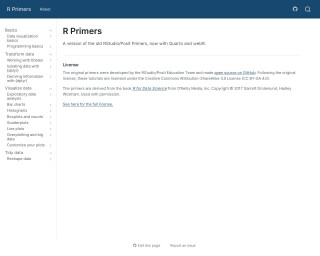
R Primers
R Primers offer updated RStudio/Posit educational content, now utilizing Quarto and webR. Originally developed by RStudio/Posit Education Team, these open-source tutorials help users learn R programming, deriving content from the book 'R for Data Science'. They are licensed under the CC BY-SA 4.0, ensuring wide accessibility for learners to improve their data science skills with R.
Go to Resource
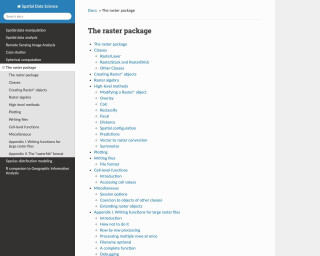
raster
The raster package is an R package for spatial data manipulation and analysis. It provides classes and functions for creating, manipulating, and analyzing raster data. The package includes high-level methods for raster algebra, overlay operations, distance calculations, and more. It also supports writing and reading raster files in various formats. The raster package is commonly used for remote sensing image analysis, species distribution modeling, and other spatial data science tasks.
Go to Resource
resouRces
This content encompasses a comprehensive list of R-related educational materials, packages, tutorials, and datasets with projected dates ranging up to the year 2025. It includes various titles that focus on learning R programming, data analysis, data visualization, geospatial mapping, and statistical methods. Significant emphasis is placed on resources for learning R, such as introductions to R, books, courses, and video tutorials. Additionally, specific packages for data wrangling, statistical modeling, and visualization are mentioned, indicating the evolution and specialization of R's ecosystem to cater to diverse data science needs.
Go to Resource