
Resources
This carefully curated collection of resources will help you find packages and learning resources to help you on your R journey.
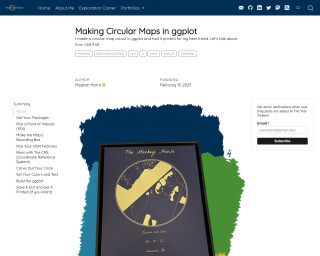
The Tidy Trekker - Making Circular Maps in ggplot
Learn how to create circular maps in ggplot using R, with a step-by-step tutorial and code examples.
Go to Resource
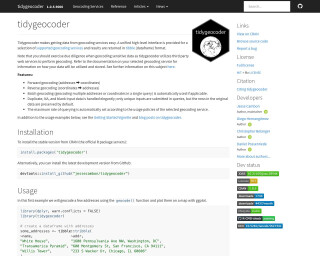
tidygeocoder
Tidygeocoder is an R package that makes getting data from geocoding services easy. It provides a unified high-level interface for a selection of supported geocoding services and returns results in tibble (dataframe) format.
Go to Resource
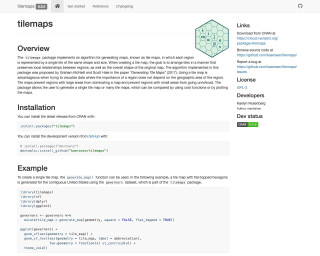
tilemaps
The tilemaps package implements an algorithm for generating tile maps, which represent regions with single tiles of the same shape and size. This package allows users to generate single or multiple tile maps and provides functions for visualizing and analyzing the maps.
Go to Resource
Time-aware isochrones for accessibility mapping with R and Mapbox tools
This article discusses creating time-aware isochrones to analyze accessibility at different times of the day using R and Mapbox tools. It demonstrates how to work with traffic data and visualize the impact of traffic using Mapbox's predicted traffic data. The tutorial includes step-by-step instructions and code snippets for generating isochrones for specific addresses at different times, and visualizing them interactively on a map with a comparison slider to highlight the accessibility differences at noon versus rush hour. The tools discussed are the R packages mapboxapi and mapgl.
Go to Resource
tmap
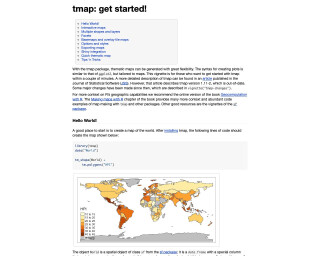
A tutorial to get started with the tmap package in R for creating thematic maps.
Go to Resource
tmap vs. ggplot2 for mapping
This content provides insights into the author's experience updating R code snippets for the Computing Geographically website, with a focus on transitioning from tmap version 3 to version 4, alongside adopting ggplot2 for everyday mapping tasks. It compares the two packages, tmap and ggplot2, which both utilize a grammar of graphics approach but serve different purposes. The author discusses the advantages of using tmap, a package specifically designed for mapping, over ggplot2, a general-purpose visualization tool, with examples such as choropleth maps and raster data handling. The post also warns about potential issues with backward compatibility in both packages and showcases code examples.
Go to Resource
urbanmapr
The urbnmapr package provides state and county shapefiles in tibble format that are compatible with mapping using ggplot2. It includes shapefiles for Alaska and Hawaii, transformed to be displayed as insets within the continental United States. The package uses shapefiles from the US Census Bureau and converts them to sf format. It also adds various identifiers for merging data and includes options to add territories to the state and county maps.
Go to Resource
Visualize Census Data in Maps at the Block Level with R
Bastián Olea nos guÃa en cómo visualizar los recientemente lanzados datos del Censo de Población y Vivienda de Chile de 2024 en mapas a nivel de manzana. En el tutorial, aprenderemos dos métodos para mapear datos censales: utilizando mapas estáticos con el paquete {ggplot2}, y creando mapas interactivos con {mapgl}. Se inicia con la descarga de datos cartográficos desde la página del INE y se procede a cargarlos con {arrow}. Finalmente, se preparan y visualizan los datos espaciales con {dplyr} y {sf} para generar visualizaciones detalladas y útiles.
Go to Resource
zipcodeR
zipcodeR is an R package that makes working with ZIP codes in R easier. It provides data on all U.S. ZIP codes using multiple open data sources, making it easier for social science researchers and data scientists to work with ZIP code-level data in data science projects using R.
Go to Resource