
Resources
This carefully curated collection of resources will help you find packages and learning resources to help you on your R journey.
rspatialdata
rspatialdata is an online resource featuring a compilation of data sources and tutorials aimed at helping users download and visualize spatial data using R. The platform is maintained by Paula Moraga and Laurie Baker and includes topics like administrative boundaries, Open Street Map data, population, climate variables (e.g., elevation, temperature, rainfall, humidity), vegetation, land cover, and health and environmental data (DHS, Malaria, Air Pollution, Species Occurrence). It's an open learning material with updates and community contributions, ideal for researchers and students in spatial analysis.
Go to Resource
rspatialdata
rspatialdata is an online resource featuring a compilation of data sources and tutorials aimed at helping users download and visualize spatial data using R. The platform is maintained by Paula Moraga and Laurie Baker and includes topics like administrative boundaries, Open Street Map data, population, climate variables (e.g., elevation, temperature, rainfall, humidity), vegetation, land cover, and health and environmental data (DHS, Malaria, Air Pollution, Species Occurrence). It's an open learning material with updates and community contributions, ideal for researchers and students in spatial analysis.
Go to Resource
Second edition of Geocomputation with R is complete – geocompx
The blog post announces the near-completion of the second edition of 'Geocomputation with R.' It showcases the three-year journey of updating and enhancing the content, discussing improvements and pending tasks. This edition integrates changes in the R ecosystem, such as the introduction of the terra package for raster data and sf package's support for spherical geometries. It revises content on spatial vector and raster data manipulation, connects R with GIS/cloud services, and addresses real-world geocomputation applications like transportation and ecology. The second edition aligns with new library standards, emphasizing the practical, hands-on nature of the open-source book.
Go to Resource
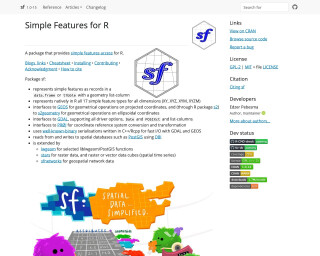
sf
Simple Features for R is a package that provides simple features access for R. It represents simple features as records in a data.frame or tibble with a geometry list-column, and interfaces with GEOS for geometrical operations on projected coordinates. It also interfaces with GDAL, supporting all driver options, and PRØJ for coordinate reference system conversion and transformation. Additionally, it supports reading from and writing to spatial databases such as PostGIS using DBI.
Go to Resource
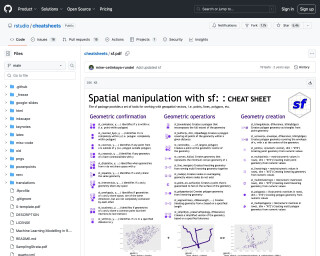
sf cheatsheet
A cheatsheet for the 'sf' package in R that provides a concise summary of spatial data manipulation and visualization functions.
Go to Resource
sf: A Tutorial
A tutorial introduction to the sf R package, which provides a powerful interface for working with geospatial data stored in vector formats.
Go to Resource
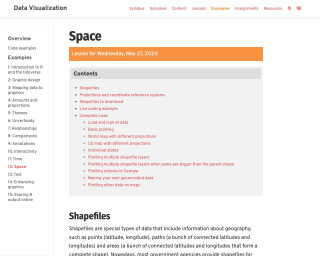
Space lesson from Data Visualization course
This resource is a lesson on using shapefiles for data visualization in R. It covers topics such as shapefile projections and coordinate reference systems, loading and plotting shapefiles, and plotting other data on maps.
Go to Resource
Spatial Data Science
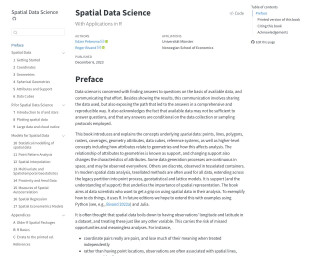
The book provides an introduction to spatial data analysis and visualization in R. It covers basic concepts and techniques for working with spatial data, including data import/export, data manipulation, spatial visualization, spatial statistics, and spatial modeling.
Go to Resource
stars
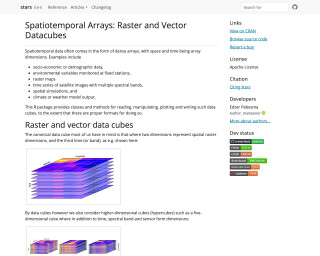
stars is an R package that provides classes and methods for reading, manipulating, plotting, and writing spatiotemporal data cubes. It supports both raster and vector data cubes, as well as regular and irregular grids. The package uses GDAL and PROJ for raster and vector operations, and provides out-of-memory (on-disk) rasters for handling large datasets. The package also includes methods for time series analysis of spatiotemporal data.
Go to Resource
statebins
statebins is an R package that provides an alternative to choropleth maps for the United States. It generates cartogram heatmaps based on the work by the Washington Post graphics department. The package includes functions for creating binned or continuous scales, legends, and different visualizations using state data.
Go to Resource
The best R packages for data visualization
The best R packages for data visualization provide a comprehensive suite of tools for creating all types of charts and graphs. Core to R's visualization capabilities is the package ggplot2, which offers a versatile grammar of graphics. Extensions of ggplot2 and other packages expand these functionalities, allowing for interactive charts, improved aesthetics, specialized geospatial analysis, and managing complex data structures like networks. Packages like plotly, rmarkdown, patchwork, and hrbrthemes enhance the user experience and presentation. Additionally, there are packages dedicated to managing colors, creating tables, and supporting specific chart types like word clouds and streamgraphs.
Go to Resource