
Resources
This carefully curated collection of resources will help you find packages and learning resources to help you on your R journey.
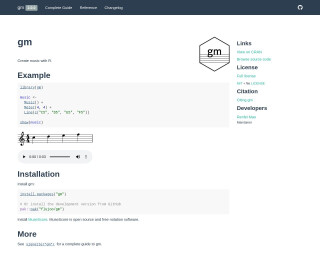
Create Music with R
The 'gm' package in R enables users to create music by programmatically defining musical elements such as meter and musical lines. It offers an ease of composing music within R. Using functions like 'Music()', 'Meter()', and 'Line()', users can construct and visualize melodies. The package is easily installable from CRAN or GitHub for the development version. Integration with MuseScore, a free notation software, allows for a seamless music notation experience. The 'gm' package is open-source under the MIT license, with detailed documentation available in its vignette.
Go to Resource
Create paint by numbers images
The 'paintr' GitHub repository hosts an R package for creating paint-by-numbers images. It leverages the 'magick' package for image processing and color picking, and 'sf' and 'rmapshaper' packages for handling image polygons. Users can apply noise reduction, smoothing, and polygon simplification to adjust the image feel. It also allows for custom color palettes. The repository contains examples, including usage with Hadley Wickham's photo, demonstrating how to generate a paint-by-numbers result and apply different palettes for the desired artistic effect.
Go to Resource
Create Sankey and Alluvial Diagrams Using ggplot2 • ggsankeyfier
The ggsankeyfier package enhances ggplot2 by allowing the creation of Sankey and Alluvial diagrams, which are types of data visualization that depict the flow of quantities through stages or categories. It provides specialized functions to handle the complex layout of these diagrams, including the ability to model skipped stages or feedback loops. The package defines its own terms for consistency and offers a thesaurus for commonly used Sankey terminology. It can be installed from CRAN or GitHub and is integrated into the ggplot2 workflow, requiring structured data for plotting.
Go to Resource
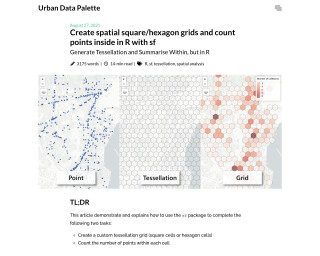
Create spatial square/hexagon grids and count points inside in R with sf | Urban Data Palette
Create spatial square/hexagon grids and count points inside in R with sf
Go to Resource
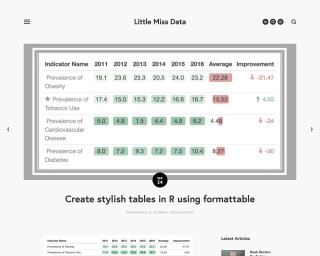
Create stylish tables in R using formattable
Create stylish tables in R using formattable
Go to Resource
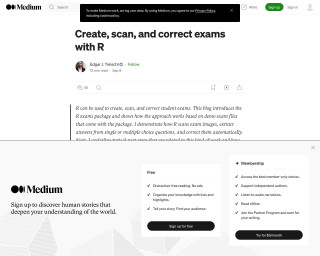
Create, scan, and correct exams with R | by Edgar J. Treischl | Medium
This blog introduces the R exams package and shows how to create, scan, and correct student exams using R. It demonstrates how R scans exam images, extracts answers from single or multiple choice questions, and corrects them automatically. It also highlights the next steps and how they are implemented in R, as well as how to create your own exam questions. The package helps automate the entire process of generating, scanning, and assessing exams.
Go to Resource
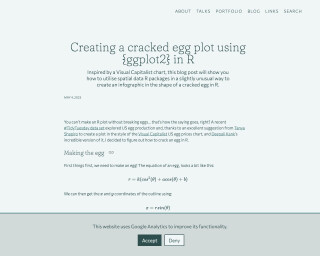
Creating a cracked egg plot using {ggplot2} in R | Nicola Rennie
Creating a cracked egg plot using {ggplot2} in R
Go to Resource
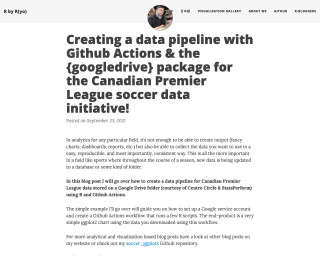
Creating a data pipeline with Github Actions & the {googledrive} package for the Canadian Premier League soccer data initiative!
Creating a data pipeline with Github Actions & the {googledrive} package for the Canadian Premier League soccer data initiative!
Go to Resource
Creating actually publication-ready figures for journals using ggplot2
Jorn Alexander Quent's tutorial introduces a workflow using ggplot2 for creating figures that are truly ready for journal publication. The guide begins by emphasizing the need to start with the correct dimensions as per journal guidelines. Quent then addresses the common problem of exported figures looking different than expected and offers solutions like using standard settings and custom themes. He also provides examples using the iris dataset to illustrate how to prepare figures that maintain proper proportions and aesthetics when saved at required dimensions, thus saving time and maintaining consistency in the figures produced.
Go to Resource
Creating Effective Display Tables with the gt Package
This content is a comprehensive guide titled 'Creating Effective Display Tables with the gt Package' by Richard Iannone. It introduces readers to building professional tables using the gt package in R. The book starts with basic table creation and progresses to advanced customization, with a focus on clarity, design, and functionality. It offers an intuitive, incremental approach to table building, with detailed instructions on formatting, layouts, and customization options for various output formats. Designed for a range of R users, the resource is both a tutorial and reference, containing reproducible examples, full code, and documented datasets for practical learning.
Go to Resource

Creating interactive visualizations with {ggiraph} (with or without Shiny)
Albert Rapp's blog post explains how to create interactive visualizations using the {ggiraph} package with or without Shiny in the R programming environment. It guides readers through the process of turning a ggplot into an interactive plot where users can focus on details that interest them. The tutorial includes data preparation with 'dplyr' and 'ggplot2', and demonstrates how to add interactivity to both lines and points in a chart. The post covers the use of 'geom_point_interactive', 'geom_line_interactive', and 'girafe()' function for rendering, and customization options for hover effects and plot sizing.
Go to Resource
Creating messy datasets for teaching purposes with {truffle}
The {truffle} R package, designed by Ian Hussey for educational purposes, helps users learn data processing by generating 'messy' datasets. It provides tools to create both 'truffles'—deliberate known effects to be uncovered—and 'dirt'—intentional complications that resemble common data issues. The package allows customization of demographics and Likert-scale items, and embeds effects such as group differences, correlations, and specific reliability coefficients. However, {truffle} has limitations in flexibility, error handling, and study design scope. It is compared with other R packages like {lavaan}, {latent2likert}, and {wakefield}, highlighting its unique focus on creating challenging datasets for data-wrangling education.
Go to Resource