
Resources
This carefully curated collection of resources will help you find packages and learning resources to help you on your R journey.
Dengue Data Hub
The Dengue Data Hub is a centralized platform that provides access to global dengue-related data across 225 countries. Launched and managed by Dr. Thiyanga S. Talagala, the hub is funded by the R Consortium, based in the USA. It is designed to facilitate the research and analysis of dengue fever patterns and trends. Users can explore and download datasets to study the impact of the disease, understand its prevalence, and potentially aid in the development of preventative measures. Researchers looking for dengue data can contact Dr. Talagala for more information.
Go to Resource
Dependency-light hex stickers with {gex}
Rostrum.blog introduced a new R package, {gex}, formerly known as {hexbase}, for creating hexagon stickers. It aims to be lightweight by including only 'gridverse' packages. 'Gex' is a play on 'grid' and 'hex'. The post explains how {gex} differs from {hexbase} in creating hex stickers with R's grid system, using functions like add_border() that applies a cut-out effect for borders. Users can add text and images to hexagon shapes with a sequence of commands. The example demonstrates hex creation for the {gex} logo with image manipulation using {magick} and showcases loops for multiple images and text effects.
Go to Resource
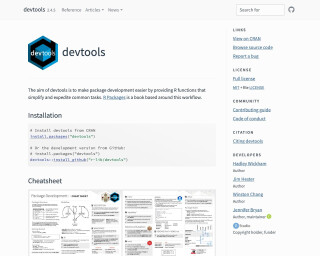
devtools
devtools is an R package that aims to make package development easier by providing functions that simplify and expedite common tasks. It includes functions for loading code, updating documentation, running tests, building and installing packages, checking and releasing packages, and more. It is widely used for R package development and there are several resources available to learn more about package development using devtools.
Go to Resource

Don't use Quarto documents to clean or analyze data
This content advocates against using Quarto, R Markdown, or Jupyter for data cleaning and analysis, emphasizing that these platforms should be used for communication rather than exploratory tasks. Diego Catalan Molina advises that data inputs should be clean before being loaded into documents which should serve as a vehicle to tell a story. He suggests creating engaging outlines focused on findings' importance and using these documents exclusively to share results, not every plot or table during the exploratory phase of data analysis.
Go to Resource
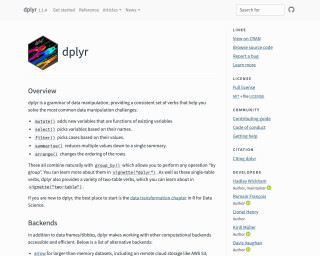
dplyr
dplyr is a package in R that provides a grammar of data manipulation. It offers a consistent set of verbs to solve common data manipulation challenges, such as adding new variables, selecting variables, filtering cases, summarizing data, and arranging rows. It also provides support for working with different computational backends, including arrow, dtplyr, dbplyr, duckplyr, duckdb, and sparklyr. The package can be installed as part of the tidyverse or separately.
Go to Resource
dplyr 1.2.0
dplyr 1.2.0 is a major release of the popular data manipulation package in R. The update introduces new features like filter_out() as a complement to the existing filter() function, as well as when_any() and when_all() helpers. It also adds functions such as recode_values(), replace_values(), and replace_when() to extend the capabilities for recoding and replacing data. These improvements have been shaped by the tidyverse community's tidyups proposal process, and the announcement encourages users to install the update from CRAN. Alongside providing code examples, the importance of understandable and maintainable code when filtering data is emphasized.
Go to Resource
Dr. U - Images as Facet Labels in ggplot2
This post explains how to replace the facet labels in ggplot2 with images, specifically country flags. It demonstrates how to load the required packages, obtain flag images from a GitHub repository, join the flag data with the gapminder dataset, download the flag images, generate markdown for reading the images, and create a plot with the flag images as facet labels.
Go to Resource
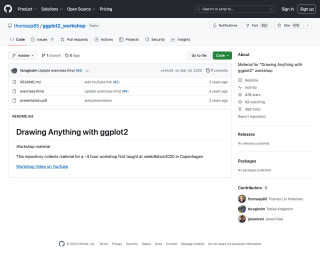
Drawing Anything with ggplot2
Material for the 'Drawing Anything with ggplot2' workshop by thomasp85
Go to Resource

DT
An R package that provides an interface to the DataTables library, allowing R data objects to be displayed as interactive tables on HTML pages.
Go to Resource
Duplicating Quarto elements with code templates to reduce copy and paste errors
This blog post from the Water Data For The Nation Blog demonstrates how to use Quarto code templates to create reproducible Quarto documents, such as reports and slideshows, with fewer errors. Using custom templates allows for the easy replication of code chunks, such as those producing statistical summaries or visualizations for different datasets. The example used is USGS streamgage data, with a focus on automating the creation of slideshows in Quarto's markdown format. Advanced topics like adding columns, tables, and speaker notes to PowerPoint slides via Quarto are also covered. Methods for iterating over data in a more efficient and less error-prone way than traditional copy and paste techniques are highlighted.
Go to Resource
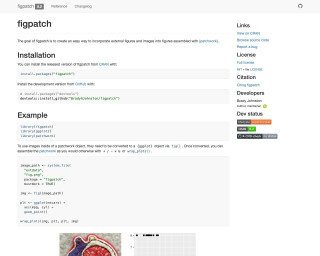
Easily Arrange External Figures with Patchwork Alongside ggplot2 Figures • figpatch
Easily Arrange External Figures with Patchwork Alongside ggplot2
Go to Resource
Easily clean up messy databases with fuzzy matching in R
This article introduces data journalists to fuzzy matching techniques using R to clean up databases with inconsistently entered text data. It outlines the challenge of recognizing similar information recorded in various ways and the computer's inability to naturally interpret them as identical. The tutorial explains 'fuzzy' matching, which identifies similarities in letter patterns to group text together more accurately. Essential R libraries like tidyverse and stringdist are loaded to demonstrate the process. Practical examples from the 2025 IRE conference schedule data show how to extract and clean session names with potential entry mistakes, using fuzzy matching to consolidate the categories accurately.
Go to Resource