Resources
This carefully curated collection of resources will help you find packages and learning resources to help you on your R journey.
Data Science Resources
Data Science Resources is a carefully selected list of free tools and references for data science, maintained by Nicola Rennie. The repository allows community contributions; individuals can propose additions or modifications to the resource list by filing an issue or editing the 'resources.csv' file on GitHub, followed by submitting a pull request. This open-source approach ensures the collection remains up-to-date and comprehensive, benefiting data scientists at various levels of expertise looking for reliable references and tools.
Go to Resource
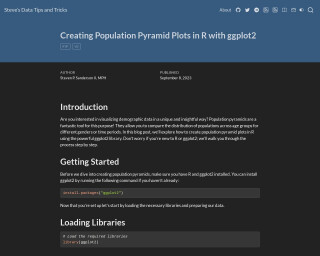
Data Tips and Tricks - Creating Population Pyramid Plots in R with ggplot2
In this tutorial, Steve guides us through creating population pyramid plots in R using the ggplot2 library. Ideal for visualizing demographic data, these plots compare population distribution across age groups and genders or different time periods. The post includes a step-by-step guide, beginning with installing ggplot2, to loading libraries and preparing data. It covers generating a basic bar chart for one gender and extending it to combine both genders, thereby constructing the desired population pyramid plot. Readers will learn how to manipulate plot aesthetics for visual clarity and symmetry in demographic presentations.
Go to Resource
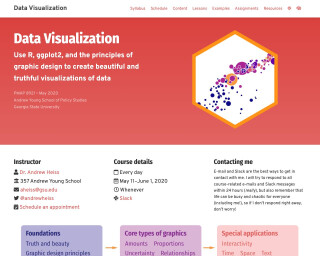
Data Visualization
Use R, ggplot2, and the principles of graphic design to create beautiful and truthful visualizations of data
Go to Resource
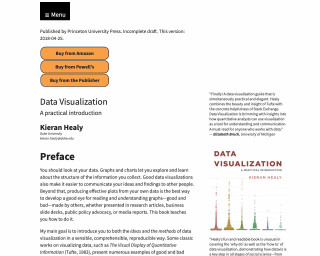
Data Visualization: A Practical Introduction
Data Visualization: A Practical Introduction, due for release in March 2026 from Princeton University Press, is a comprehensive guide that teaches the principles and methods necessary for effectively visualizing data. With a focus on R and ggplot2, the second edition incorporates significant updates, including the use of base R's pipe operator. The book aims to enable readers to reproduce the figures within and understand the underlying principles, bridging the gap between high-level concepts and practical implementation with graphical tools.
Go to Resource
Data Visualization: A Practical Introduction
This is a book about data visualization using R and ggplot. It covers various topics such as working with plain text, making plots, showing the right numbers, graphing tables, working with models, and drawing maps.
Go to Resource

Data wrangling for spatial analysis: R Workshop
Data wrangling for spatial analysis: R Workshop
Go to Resource

data.table
data.table provides a high-performance version of base R’s data.frame with syntax and feature enhancements for ease of use, convenience and programming speed.
Go to Resource

DBI
The DBI package helps connecting R to database management systems (DBMS). It separates the connectivity to the DBMS into a “front-end” and a “back-end” and provides an interface that is implemented by different DBI backends. The package supports operations like connecting to a DBMS, executing statements, extracting results, and handling errors. The DBI package is typically installed automatically when you install one of the supported database backends.
Go to Resource
dbplyr
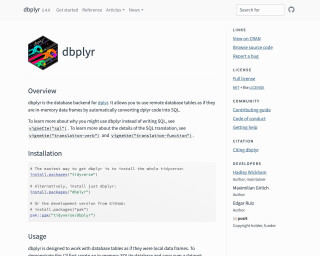
dbplyr is a database backend for the dplyr package in R. It allows you to use remote database tables as if they are in-memory data frames by automatically converting dplyr code into SQL.
Go to Resource