
Resources
This carefully curated collection of resources will help you find packages and learning resources to help you on your R journey.
Easily download files from the Open Science Framework with Papercheck
The 20% Statistician is a blog focusing on statistics, research methods, and open science. It aims to help researchers understand crucial statistical concepts, claiming that grasping 20% of statistics can improve 80% of inferences. A recent post highlights the challenge of downloading files from the Open Science Framework (OSF). The authors, DeBruine and Lakens, introduced 'Papercheck,' an R package with a function 'osf_file_download' that simplifies this process. Papercheck recreates OSF's folder structure within a local directory, making it user-friendly to access project files for review or reuse.
Go to Resource
Efficiency and Consistency: Automate Subset Graphics with ggplot2 and purrr - Cédric Scherer
Efficiency and Consistency: Automate Subset Graphics with ggplot2 and purrr is a blog post by Cédric Scherer that discusses automated plot generation with ggplot2. The post explains how to create a set of explorative or explanatory charts for different variables or categories of a dataset using a functional programming approach. It provides examples and tips for working with variables and explores data sets visually.
Go to Resource
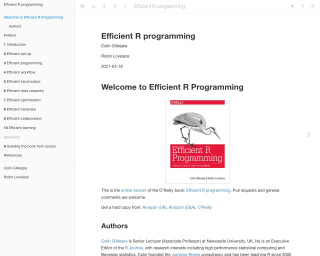
Efficient R Programming
Efficient R programming is a book that provides tips and techniques for writing efficient and optimized code in R.
Go to Resource
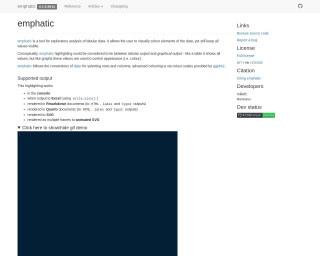
emphatic
emphatic is a package for R that enriches exploratory analysis of tabular data by allowing users to add visual color highlights. It bridges the gap between tabular and graphical output, displaying data values that control appearance, such as color, while still showing all values. Compatible with dplyr row and column selection, it also integrates with ggplot2's color scales. Outputs include console, Excel, Rmarkdown, Quarto, SVG, and animated SVG rendering. Features include data frame highlighting, difference highlighting between objects, regex matching, and conversion to HTML, SVG, or Excel. Installation via GitHub is straightforward.
Go to Resource

Engineering Production-Grade Shiny Apps
This book is a guide to building robust Shiny applications that are ready for production use. It covers topics such as project management, technical optimization, and team collaboration. The target audience includes developers who have basic knowledge of Shiny and want to build production-grade applications.
Go to Resource
Enhance Quarto Project Workflows and Standards • froggeR
froggeR is an R package designed to enhance Quarto project workflows for R users. It provides a suite of functions that automate project setup tasks, enforce consistent documentation, and allow users to focus on analysis rather than configuration. The package includes features for creating Quarto projects with custom templates, managing YAML headers, applying git protection with a comprehensive .gitignore, styling documents with SCSS templates, and generating structured project documentation. It's particularly useful for R users managing multiple Quarto projects, encouraging collaboration, and standardizing project structures.
Go to Resource
Exploratory Data Analysis in R
This content details the process of Exploratory Data Analysis (EDA) using R. It emphasizes the importance of EDA as a crucial part of data science, particularly in understanding data and identifying biases. The article introduces several R packages that facilitate EDA, including overviewR, which is particularly focused on time series data analysis but is applicable to other data types. Key features of each package are compared, and the usage of the {palmerpenguins} dataset is illustrated. Package installation, data loading, and functions like str() and summary() are discussed, giving readers an introduction to effective data analysis in R.
Go to Resource
Exploring {ggplot2}’s Geoms and Stats
This content delves into the intricacies of geoms and stats within the {ggplot2} package's Layered Grammar of Graphics. It emphasizes the way plots are constructed by adding layers, each comprising a geom and a stat. A geom dictates the visual representation, while a stat preprocesses the data. The article explains how, for instance, geom_histogram() applies a binning stat. The exploration includes R code for listing and correlating the geoms and stats in {ggplot2}, and generating a plot to visualize the combinations. Additionally, it demonstrates data extraction post-transformation.
Go to Resource
Exploring Complex Survey Data Analysis Using R
This content outlines a comprehensive guide on analyzing complex survey data using R. It begins with an introduction to survey analysis in R, prerequisites, and the datasets used, followed by detailed sections on survey design, data collection, and post-survey processing including data cleaning, weighting, and documentation. The book further delves into practical aspects like getting started with R packages, performing descriptive analyses and statistical tests, building models, and effective communication of results. Additionally, it emphasizes reproducible research with project-based workflows and version control, catering to both beginners and advanced users.
Go to Resource
Extract Data from Professional Volleyball Leagues in North America with {rvolleydata}
The R package {rvolleydata} is designed for those interested in analyzing professional volleyball data, providing a simple interface to collect structured data from North American leagues such as League One Volleyball Pro (LOVB), Athletes Unlimited Pro Volleyball (AUPVB), and Major League Volleyball (MLV). The package can be installed from CRAN for stable use or from GitHub for the development version. Comprehensive usage guidelines are available in the package vignette, which helps users employ {rvolleydata} effectively to obtain clean and tidy volleyball league data for their analyses.
Go to Resource
FakeDataR
FakeDataR is an R package designed for locally generating synthetic copies of real datasets, thereby enhancing privacy and enabling secure data sharing without exposing sensitive information. It preserves the original structure, including schema, types, factor levels, numeric ranges, and missingness, while offering heuristics for masking sensitive fields. The package supports direct integration with R for seamless LLM workflows and reproducible examples. It comes with features like bundled exports for easy sharing and database schema compatibility for data synthesis. Use FakeDataR when needing shape-consistent synthetic data while avoiding privacy breaches, not for formal privacy guarantees or statistical benchmarks.
Go to Resource
File Management With The {fs} Package
Albert Rapp's 'File Management With The {fs} Package' tutorial guides data scientists through various file system operations using the {fs} package in R. It demonstrates convenience functions that simplify tasks like path assembly, file extension modification, and directory information retrieval. Through examples, Rapp elucidates how to assemble paths regardless of trailing slashes, change file extensions for data transformation, and get directory details. The post includes code snippets and offers a video version for those who prefer learning through visual aids. Practical tips on iterating over file paths and creating organized output directories are also shared to enhance workflow efficiency.
Go to Resource