
Resources
This carefully curated collection of resources will help you find packages and learning resources to help you on your R journey.
The RedMonk Programming Language Rankings: January 2024
This content provides an overview of the RedMonk Programming Language Rankings for January 2024. Sponsored by AWS, the analysis examines programming language popularity based on GitHub pull requests and Stack Overflow discussions, aiming to forecast adoption trends rather than current usage. The methodology is a continuation of work from 2010 by Conway and Myles White, updated for changes in data sources and collection methods. While anomalies in the data suggest an impact from AI code assistants, the rankings still strive to reflect meaningful insights into language traction and potential future shifts in developer preference.
Go to Resource
The Test Set
The Test Set is a podcast series by Posit featuring discussions with key figures in data science. Listeners can expect conversations with experts like Hadley Wickham and Wes McKinney, covering topics from the inception of tidyverse to open source funding. The show dives into the personal origin stories of its guests, the evolution of data science tools, community-building, and the importance of reproducible research. The aim is to provide insights into the journeys that have shaped modern data science, and to explore the narratives that drive this field forward.
Go to Resource
The Tidy Trekker - Making Circular Maps in ggplot
Learn how to create circular maps in ggplot using R, with a step-by-step tutorial and code examples.
Go to Resource
The World Started Tracking Severe Food Insecurity in 2016
Published on October 13, 2025, this content outlines the significant rise in global tracking of Severe Food Insecurity following the year 2016. Using TidyTuesday data visualization techniques with R Programming, a line chart depicted the participation of countries from 2005 to 2025 in tracking five food security indicators. A stark increase is observed post-2016 with approximately 70% more countries reporting on Moderate/Severe Food Insecurity. The document also provides an insightful tutorial on how to load packages, read data, tidy datasets, and create engaging visuals using R, culminating in a compelling narrative about the state of food security worldwide.
Go to Resource

Tidy data for efficiency, reproducibility, and collaboration
This illustrated series discusses the power of tidy data for efficiency, reproducibility, and collaboration in data science. It emphasizes the importance of organizing data in a structured and standardized format, which enables the use of existing tools, facilitates collaboration, and enhances reproducibility. The series provides examples and resources for working with tidy data and highlights its benefits in data analysis and research.
Go to Resource
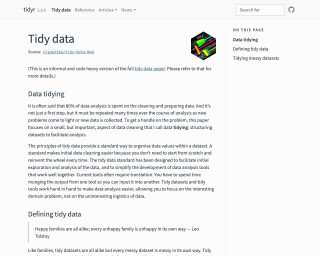
Tidy Data Vignette
Tidy data is a concept in data analysis that involves structuring datasets to facilitate analysis. The tidy data standard provides a standardized way to organize data values within a dataset. This resource is a vignette that explains the principles and importance of tidy data and provides examples in R using the tidyr package.
Go to Resource
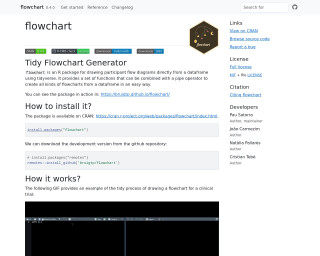
Tidy Flowchart Generator
The Tidy Flowchart Generator, or the 'flowchart' package, is an R package designed for drawing participant flow diagrams directly from a dataframe, employing the tidyverse syntax. It offers a suite of functions that utilize the pipe operator to generate flowcharts conveniently and flexibly from dataframes. The package is accessible through CRAN and can be installed traditionally or via the development version on GitHub. The process of creating a flowchart with this tool is demonstrated through a GIF example on its homepage, showcasing its usefulness in drafting flow diagrams for clinical trials or similar studies.
Go to Resource
Tidy Tuesday live screencast: Analyzing global crop yields in R
A live screencast of a Tidy Tuesday session where global crop yields are analyzed using R.
Go to Resource
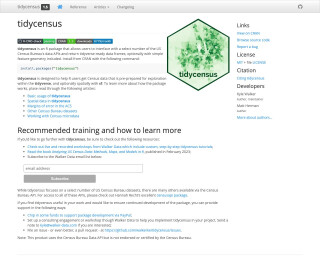
tidycensus
Load US Census Boundary and Attribute Data as tidyverse and sf-Ready Data Frames
Go to Resource
