
Resources
This carefully curated collection of resources will help you find packages and learning resources to help you on your R journey.
tidygeocoder
Tidygeocoder is an R package that makes getting data from geocoding services easy. It provides a unified high-level interface for a selection of supported geocoding services and returns results in tibble (dataframe) format.
Go to Resource
tidykids
State-by-State Spending on Kids Dataset from the Urban Institute in a Tidy Format
Go to Resource
tidylog
Tidylog provides feedback about dplyr and tidyr operations. It provides wrapper functions for the most common functions, such as filter, mutate, select, and group_by, and provides detailed output for joins.
Go to Resource
tidyr
The `tidyr` package in R is used to create tidy data, where every column is a variable, every row is an observation, and every cell is a single value. It provides functions for pivoting, rectangling, nesting, splitting and combining character columns. The package supersedes `reshape2` and `reshape` and is designed specifically for tidying data. It has an active community and a Contributor Code of Conduct.
Go to Resource
TidyTuesday: Racial disparities in reproductive research
This TidyTuesday project investigates racial and ethnic disparities in reproductive medicine in the United States, as presented in a narrative review from a January 2025 issue of the American Journal of Obstetrics and Gynecology. The dataset consists of studies from top peer-reviewed Ob/Gyn journals between 2010 and 2023, aiming to explore differences in racial group representations across study types and examine changes in representation over time. The project involves data cleaning, analysis, and visualization using R packages like tidytuesdayR, tidyverse, and ggplot2, with an intent to identify trends and recommend informed strategies for future research in obstetrics and gynecology.
Go to Resource
tilemaps
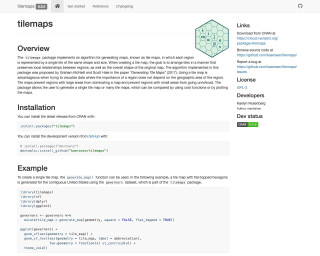
The tilemaps package implements an algorithm for generating tile maps, which represent regions with single tiles of the same shape and size. This package allows users to generate single or multiple tile maps and provides functions for visualizing and analyzing the maps.
Go to Resource
Time Series Data Sets
The timeSeriesDataSets package in R offers an extensive collection of time series datasets from diverse fields such as economics, finance, energy, and healthcare. Aimed to facilitate time series analysis, the datasets include suffixes for easy identification. For instance, AirPassengers_ts represents monthly airline passenger numbers, while taylor_30_min_df_ts indicates half-hourly electricity demand. Users can install the package from CRAN and access datasets using simple commands. This package is valuable for those seeking structured time series data for research or analysis in various domains.
Go to Resource
Time-aware isochrones for accessibility mapping with R and Mapbox tools
This article discusses creating time-aware isochrones to analyze accessibility at different times of the day using R and Mapbox tools. It demonstrates how to work with traffic data and visualize the impact of traffic using Mapbox's predicted traffic data. The tutorial includes step-by-step instructions and code snippets for generating isochrones for specific addresses at different times, and visualizing them interactively on a map with a comparison slider to highlight the accessibility differences at noon versus rush hour. The tools discussed are the R packages mapboxapi and mapgl.
Go to Resource
Tips for debugging and cleaning broken code
This guide provides strategies for debugging and cleaning broken R code, specifically in a data visualization context using 'dplyr' and 'ggplot2'. It helps identify common mistakes in function chaining and plot layering, offering tips on how to spot and fix errors such as misspelled words or misplaced punctuation. The article illustrates the debugging process using an example with incorrect R code, followed by the corrected version. The guide emphasizes the importance of code formatting and reindenting for troubleshooting, making the debugging process less daunting.
Go to Resource
tmap
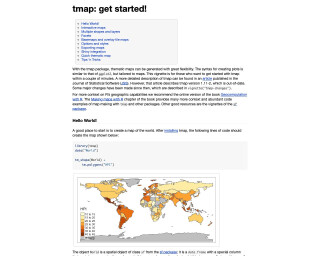
A tutorial to get started with the tmap package in R for creating thematic maps.
Go to Resource
tmap vs. ggplot2 for mapping
This content provides insights into the author's experience updating R code snippets for the Computing Geographically website, with a focus on transitioning from tmap version 3 to version 4, alongside adopting ggplot2 for everyday mapping tasks. It compares the two packages, tmap and ggplot2, which both utilize a grammar of graphics approach but serve different purposes. The author discusses the advantages of using tmap, a package specifically designed for mapping, over ggplot2, a general-purpose visualization tool, with examples such as choropleth maps and raster data handling. The post also warns about potential issues with backward compatibility in both packages and showcases code examples.
Go to Resource