
Resources
This carefully curated collection of resources will help you find packages and learning resources to help you on your R journey.
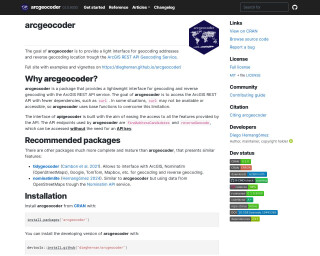
{arcgeocoder} package for geocoding
arcgeocoder is an R package that serves as a lightweight interface for geocoding and reverse geocoding using the ArcGIS REST API Geocoding Service. It allows R users to easily convert addresses to geographic coordinates and vice versa without needing an API key. The package is designed to work with base R functions, avoiding dependencies like curl, making it accessible in environments where curl isn't available. arcgeocoder is advantageous when quick and simple access to geocoding services is needed, and it includes functions like arc_geo() for geocoding and arc_reverse_geo() for reverse geocoding.
Go to Resource
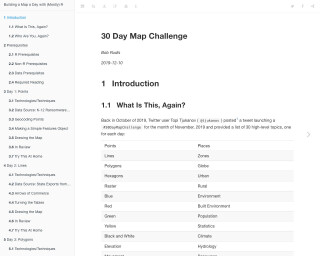
30 Day Map Challenge
Building a Map a Day with (Mostly) R is a 30-day challenge where each day, a map is created using R. The challenge covers various map types and techniques using different data sources. The tutorial provides step-by-step instructions on how to create each map and includes code examples. The challenge is suitable for those who are familiar with R and want to enhance their mapping skills.
Go to Resource
3D city building maps with R - YouTube
This YouTube video is about creating 3D city building maps using R.
Go to Resource

An Exploration of Simple Features for R
Introduction to GIS with R through the sp and sf packages.
Go to Resource
An Exploration of Simple Features for R
An exploration of the implementation of simple features standard by the sf package for R
Go to Resource
Animated active fire maps using NASA FIRMS data in R
This video tutorial demonstrates how to create animated active fire maps using NASA's Fire Information for Resource Management System (FIRMS) data within R. Viewers will learn the techniques for importing and handling satellite-derived fire data, processing it, and then visualizing the active fire spots over time using animation tools in R. The tutorial is designed for data analysts, environmental researchers, and GIS specialists interested in mapping and geospatial analysis to monitor wildfires and understand spatial patterns using NASA's publicly available data sets in R programming environment.
Go to Resource
Atmospheric Simulation in R
Tyler Morgan-Wall's 'Atmospheric Simulation in R' dives into the intriguing world of atmospheric models and data visualization within the R ecosystem. Part of the larger 'Rayverse' suite, this content includes extensive tutorials and package development insights for specialized R packages like Rayshader, Rayrender, Rayvertex, Rayimage, and skymodelr. It appeals to readers interested in simulating atmospheric phenomena and rendering them visually. Published in March 2026, it is a must-read for data scientists and enthusiasts keen on pushing the boundaries of 3D visualization and atmospheric simulation using R.
Go to Resource

Bivariate choropleths are go!
This post explores bivariate choropleth maps, which blend two semi-transparent color schemes to represent two variables on a map. It delves into the practicalities of creating such maps with modern tools like R libraries, demonstrating the ease with which these visualizations can now be created. The post also touches on the modifiable areal unit problem (MAUP) and provides background on the development of bivariate choropleths in cartography. It offers a tutorial on using tmap to create these maps, referencing the work of Joshua Stevens and Cindy Brewer in the field.
Go to Resource
Charting 'tidycensus' data with R
This blog post by USGS Vizlab discusses how to use the 'tidycensus' R package to download and visualize U.S. Census Bureau data. It highlights visualizations such as line charts, bubble maps, cartograms, geofaceted area plots, rainfall plots, and grid charts. The post includes code examples and downloadable functions from GitHub to replicate these visualizations using data on 'households lacking plumbing' from the 2022 and 2023 ACS. It offers a practical guide for users interested in creating similar visualizations for demographic and socioeconomic data within the United States.
Go to Resource

Choropleth Map with Bar Chart in R – the R Graph Gallery
This R Graph Gallery tutorial demonstrates how to create a choropleth map combined with a bar chart in R, using ggplot2 and the patchwork package. The tutorial includes steps and code snippets for data import, manipulation, and visualization. It focuses on visualizing the Human Development Index (HDI) across subregions of Sao Paulo, Brazil. The post introduces binning of continuous variables, customizing plots, theming, and handling geospatial data with the sf package. It also walks through calculating population proportions by HDI groups. Data for the tutorial is hosted on GitHub.
Go to Resource
Create custom GPS route maps in R
This content is a tutorial by Nicola Rennie, published on November 23, 2025, about creating custom GPS route maps in R. It provides a step-by-step guide on how to use spatial data to produce printable maps, ideal for runners, cyclists, or anyone interested in learning about spatial data handling in R. The tutorial includes loading GPS data from files (such as .gpx), processing it using R packages like 'gpx', 'tidyverse', and 'sf', and then enhancing the maps with background data from OpenStreetMap through the 'osmdata' package.
Go to Resource