
Resources
This carefully curated collection of resources will help you find packages and learning resources to help you on your R journey.
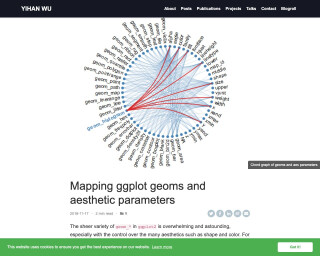
Mapping ggplot geoms and aesthetic properties
A blog post by Yihan Wu about mapping ggplot geoms and aesthetic parameters using the ggplot2 package in R.
Go to Resource
Mapping water insecurity in R with tidycensus
This content provides a comprehensive guide on utilizing the tidycensus package in R to map water insecurity based on American Community Survey data. It elaborates on setting up the tidycensus environment, exploring Census Bureau variables, and performing data processing. Techniques like data visualization with tigris and sf packages are also covered. The tutorial highlights differences in plumbing facilities and compares population versus plumbing access across Western U.S. counties. With practical code examples, it aids readers in understanding and visualizing the spatial variation of social vulnerability indicators affecting water insecurity.
Go to Resource
mazegenerator: Maze generator built in R
Mazegenerator is a project on GitHub by matfmc for generating mazes using R. It leverages a random walk algorithm to create mazes and provides tools for visualization. It offers features such as generating custom-sized mazes, visualizing the generation process with animations, customizable aesthetics, and export functions for the mazes. It can display node numbers and paths, and it requires the 'magick' package in R for installation. Users can create mazes, adjust their properties, and generate static or animated visual representations of the maze generation process using the provided R scripts.
Go to Resource
Miriam Lerma: Add text on images using R
This article explains how to add text to images in R and merge two images using the {magick} package. It covers installation and usage of the package, selecting the working directory, and loading images with 'image_read'. The article demonstrates how to annotate images with text at specific locations and export the modified images using 'image_write'. Additionally, it shows how to add a border to images and combine them side by side into a single image before exporting. The guide includes code snippets and is suitable for those looking to edit images programmatically in R without image compression issues.
Go to Resource
Modern Data Science with R
Modern Data Science with R is a comprehensive data science textbook that incorporates statistical and computational thinking to solve real-world problems with data. It covers topics such as data wrangling, data visualization, inferential statistics, and more. The book is currently in its 3rd edition and includes updates and changes to reflect the evolving R ecosystem. It also provides instructor resources, reviews, and errata on its website.
Go to Resource

Modern Data Visualization with R
Modern Data Visualization with R by Robert Kabacoff is a comprehensive guide for creating a wide array of visualizations using R, specifically with the ggplot2 package. The online version, slated for print by CRC Press and Amazon, covers data import, cleaning, and preparation followed by an in-depth exploration of various graph types such as univariate, bivariate, and multivariate graphs. It also delves into topics like mapping, time-dependent graphs, statistical models, and customization of plots. Interactive graphs and best practices in data visualization are discussed to enhance the reader's graphing skills.
Go to Resource
Modern Data Visualization with R
Modern Data Visualization with R is a comprehensive guide by Robert Kabacoff on data visualization techniques using the R programming language. This book, available in both online and print versions, emphasizes the use of ggplot2 for creating a variety of charts and plots. Covering topics from importing and cleaning data to customizing and saving graphs, the book includes worked examples and best practices to help readers create publication-ready graphics. The content also introduces interactive graphing tools and offers advice on graph aesthetics such as color choice and signal-to-noise ratio.
Go to Resource
Neon Ghosts with ggplot2
This content details Dr. Mowinckel's Halloween-themed tutorial on creating neon ghosts using the ggplot2 package in R. The tutorial provides a step-by-step guide with accompanying code to generate randomized ghost shapes and add neon glows for a spooky effect. Different neon colors are used for multiple ghost illustrations, and the code includes a function for plotting simple ghosts with variable sizes and wiggles. The blog also mentions a method to cite the work, indicating the author's intent for users not just to learn but also to use and reference the generated graphics.
Go to Resource
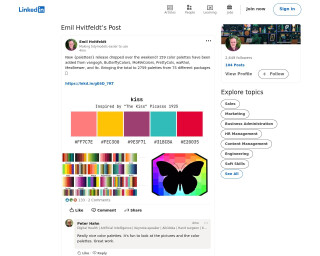
New {paletteer} release dropped over the weekend! 159 color palettes have been added
The content discusses Emil Hvitfeldt's LinkedIn post about a new release of the {paletteer} R package, which added 159 color palettes, bringing the total to 2759 palettes from 75 packages. It highlights the usefulness and aesthetic appeal of the palettes as articulated by community members, demonstrating the package's positive reception and usage within data visualization in R.
Go to Resource

New features in {gt} package
The blog post highlights the new features introduced in {gt} 0.10.0, a package for creating tables in R. Developed by Posit, formerly RStudio, the update includes novel functionalities like nanoplots and units notation. Rich Iannone, a software engineer at Posit, outlines these enhancements. He's known for his work on R packages like {gt} and {blastula} and his contributions to the Quarto project. His talk of exploration and adventure reflects his passion beyond coding. The article encourages subscribing for more insightful open-source data science content.
Go to Resource
New, work-in-progress book on spatial data visualization in R
This is an announcement of a work-in-progress book titled Spatial Data Visualization with tmap: A Practical Guide to Thematic Mapping in R, to be published on October 14, 2025. The book is designed for various levels of expertise, from beginners to experienced GIS users and covers the usage of the tmap package in R for creating thematic maps. The online version is currently available, with the first three parts mostly complete, and further chapters in development. The tmap package has seen significant updates in version 4.0, adding features like improved defaults and expanded faceting options. The book is part of the geocompx project.
Go to Resource
Nightlife of Barcelona Neighborhoods
The blog post by Jose M Sallan provides an in-depth spatial analysis of nightlife within the neighborhoods of Barcelona. It builds on the author's previous district-level analysis to evaluate neighborhoods based on the number and density of venues. The post includes choropleth maps and data wrangling examples. To perform the analysis, it uses sf for spatial analysis, with data sourced from BAdatasetsSpatial. The author also utilizes the tidyverse and kableExtra packages for data manipulation, plotting, and creating tables. The post showcases code snippets for loading, processing, and presenting geographical information, as well as generating and interpreting maps.
Go to Resource