
Resources
This carefully curated collection of resources will help you find packages and learning resources to help you on your R journey.
Price index data for the US economy
The 'realtalk' R package provides datasets for common US price indexes such as the CPI-U-RS and PCE. It enables easy access and manipulation of price index data. Users can view available datasets and obtain specific price index data through functions like available_price_indexes and get_price_index(). The package also includes annual, monthly, and quarterly data with various start and end dates. Installation instructions are provided for getting started with the package. This can be especially useful for economists and data analysts working with time series data in the economic domain.
Go to Resource

Quarto Extensions
This content presents a catalog of various Quarto extensions, complete with metadata such as the release date, author, version, and the number of stars on GitHub. The extensions cover a wide array of functionalities to enhance HTML documents, websites, blogs, books, and academic publications. Some specific features include embedding webR, minimalist themes for presentations, APA7 document formatting, countdown timers, inclusion of vector icons, and integration of interactive elements like Shinylive and code editors. The Quarto extensions support a diversity of outputs, such as PDF, HTML, and slides, and cater to needs in publishing, theming, and interactivity.
Go to Resource
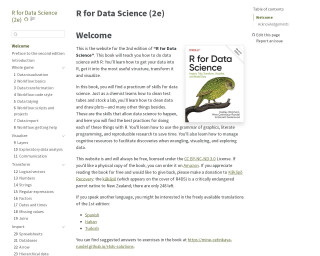
R for Data Science (2e)
R for Data Science (2e) is a comprehensive guide to performing data science tasks with R. It covers how to import, structure, transform, and visualize data while teaching best practices in data cleaning, plotting, and more. The book promotes literate programming and reproducible research to streamline work. It supports cognitive resource management for data wrangling and exploration. The content is freely available under the CC BY-NC-ND 3.0 License, with an option to support kākāpō conservation. Physical copies can be ordered on Amazon, and solutions to exercises are provided online.
Go to Resource
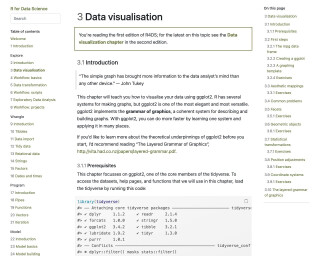
R for Data Science: Chapter 3: Data Visualization
This chapter teaches you how to visualize your data using ggplot2 in R. It covers the basics of creating different types of plots and customizing them.
Go to Resource
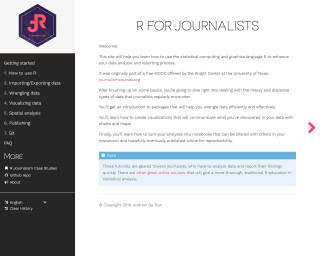
R for Journalists
This is a resource for journalists to learn how to use the R programming language for data analysis and reporting. It covers topics such as installing R and RStudio, importing/exporting data, data wrangling, data visualization, spatial analysis, publishing with RMarkdown, and using Git for version control. The tutorials are designed to help journalists quickly analyze data and report their findings.
Go to Resource
R Graph Gallery
The R Graph Gallery is a collection of charts made with the R programming language. It features a wide range of chart types and provides reproducible code and explanations for each example. The gallery focuses on the tidyverse and ggplot2 packages. It also showcases the best R charts created by leading creators in the field.
Go to Resource
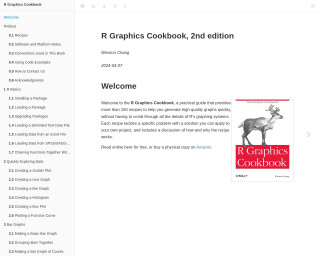
R Graphics Cookbook
The R Graphics Cookbook is a practical guide that provides more than 150 recipes to help you create high-quality graphics in R. This second edition of the book covers various topics such as data exploration, bar graphs, line graphs, scatter plots, and more. Each recipe provides a problem, a solution, and a discussion of the code, allowing you to learn and understand the concepts behind creating effective graphics.
Go to Resource
R Graphics Cookbook, 2nd edition
The 'R Graphics Cookbook, 2nd edition' serves as a practical guide that offers a wide array of graphical examples using R. It encompasses a collection of recipes addressing common tasks and problems for creating graphics in R. The book is designed to help readers quickly find and implement solutions for various data visualization scenarios, covering topics from basic R installation, loading packages, and importing data, to generating different types of plots such as bar graphs, line graphs, and scatter plots. Essential for both beginners and experienced R users, the cookbook-style format makes it an accessible and valuable resource for effective data visualization.
Go to Resource
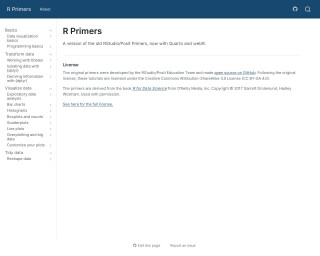
R Primers
R Primers offer updated RStudio/Posit educational content, now utilizing Quarto and webR. Originally developed by RStudio/Posit Education Team, these open-source tutorials help users learn R programming, deriving content from the book 'R for Data Science'. They are licensed under the CC BY-SA 4.0, ensuring wide accessibility for learners to improve their data science skills with R.
Go to Resource
R Workshop: Handling Uncertainty in your Data
This R Workshop titled 'Handling Uncertainty in your Data' is designed to educate participants on managing data uncertainty. Organized by Dr. Mario Reutter and Juli Nagel, and sponsored by IGOR, the workshop spans two afternoons with sessions on R basics, measurement precision theory, and practical techniques for computing confidence intervals and uncertainty visualization in R. Additionally, it provides a general intro to R, data wrangling, and visualization, with a spotlight on translating measurement precision into visual representations.
Go to Resource

Recreate a real-world, complex dataviz with R & ggplot - YouTube
Recreate a real-world, complex dataviz with R & ggplot - YouTube
Go to Resource