
Resources
This carefully curated collection of resources will help you find packages and learning resources to help you on your R journey.

Stat545
This is the table of contents for the STAT 545 resource, which covers various topics related to R programming.
Go to Resource
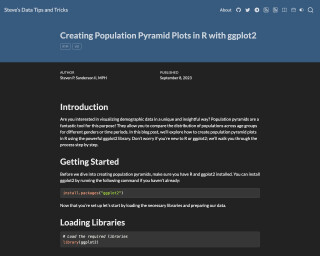
Steve’s Data Tips and Tricks - Creating Population Pyramid Plots in R with ggplot2
Learn how to create population pyramid plots in R using ggplot2. This tutorial provides step-by-step instructions and sample code.
Go to Resource
Stop making messy line charts and create meaningful plots instead
Stop making messy line charts and create meaningful plots instead
Go to Resource
STOP Wasting Space on HUGE LEGENDS | A ggplot2 step-by-step guide - YouTube
A step-by-step guide on how to create more compact legends in ggplot2.
Go to Resource
Take A Sad Plot & Make It Better: A Case Study with R and ggplot2
A case study with R and ggplot2 on improving a sad plot
Go to Resource
The best R packages for data visualization
The best R packages for data visualization provide a comprehensive suite of tools for creating all types of charts and graphs. Core to R's visualization capabilities is the package ggplot2, which offers a versatile grammar of graphics. Extensions of ggplot2 and other packages expand these functionalities, allowing for interactive charts, improved aesthetics, specialized geospatial analysis, and managing complex data structures like networks. Packages like plotly, rmarkdown, patchwork, and hrbrthemes enhance the user experience and presentation. Additionally, there are packages dedicated to managing colors, creating tables, and supporting specific chart types like word clouds and streamgraphs.
Go to Resource
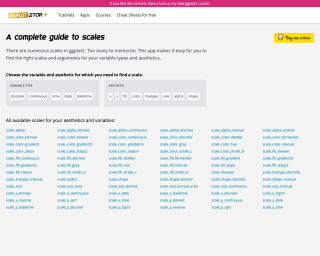
The ggplot flipbook
The ggplot flipbook is a book made with xaringan that introduces the ggplot2 package in R. It explains the concept of the layered grammar of graphics and demonstrates a 'slow ggplotting' method for building plots incrementally. The book provides examples and code snippets to help users learn how to use ggplot2 effectively for data visualization.
Go to Resource
The Glamour of Graphics
In this talk, William Chase presents design principles that can be applied to transform any chart from drab to fab. He focuses on the 'Glamour of Graphics' and how it can be implemented in ggplot to improve the visual appeal and persuasive power of charts.
Go to Resource
The guide to gradients in R and ggplot2
This content is a comprehensive guide to using gradients in R and ggplot2, created by James Goldie. It covers everything from basic gradient applications to creating advanced mesh gradients within ggplot2 for enhanced visualization. The guide, published on February 24, 2025, includes examples and tutorials for applying gradient effects to various plot elements in R's ggplot2 package, utilizing functions from the 'grid' package, and considerations for themes and aesthetic choices. It also touches on the support for gradients in R version 4.1 and ggplot2 version 3.5.0, as well as how to work with system fonts and R graphics devices that support gradients.
Go to Resource
The MockUp - Creating and using custom ggplot2 themes
Creating and using custom ggplot2 themes
Go to Resource
The World Started Tracking Severe Food Insecurity in 2016
Published on October 13, 2025, this content outlines the significant rise in global tracking of Severe Food Insecurity following the year 2016. Using TidyTuesday data visualization techniques with R Programming, a line chart depicted the participation of countries from 2005 to 2025 in tracking five food security indicators. A stark increase is observed post-2016 with approximately 70% more countries reporting on Moderate/Severe Food Insecurity. The document also provides an insightful tutorial on how to load packages, read data, tidy datasets, and create engaging visuals using R, culminating in a compelling narrative about the state of food security worldwide.
Go to Resource